
Lies, Damn Lies, and Statistics
What’s a lie—and can we see it coming?
Over the past few years, I’ve changed how I consume information—news, politics, even everyday claims. I no longer assume that authority equals accuracy.
Instead, I do two things:

It takes more time. But it replaces certainty with clarity.
That framework is why I paused when the Department of Homeland Security released this headline on January 19, 2026:
“ICE Continues to Remove the Worst of the Worst from Minneapolis Streets as DHS Law Enforcement Marks 3,000 Arrests During Operation Metro Surge.”
The accompanying statement went further, claiming:
Today, the U.S. Department of Homeland Security (DHS) released the following statement and information regarding U.S. Immigration and Customs Enforcement (ICE) arrests of dangerous criminal illegal aliens in Minneapolis, Minnesota over the weekend including murderers, rapists, gang members, and perpetrators of fraud.

“We have arrested over 10,000 criminal illegal aliens who were killing Americans,hurting children and reigning terror in Minneapolis because Tim Walz and Jacob Frey refuse to protect their own people and instead protect criminals,” said Secretary Kristi Noem.
“In the last 6 weeks, our brave DHS law enforcement have arrested 3,000 criminal illegal aliens including vicious murderers, rapists, child pedophiles, and incredibly dangerous individuals. A huge victory for public safety.”
The next day, Donald Trump amplified the message at a press conference, holding up mugshots and asking, “Do you want to live with these people?” He described those arrested as so violent they “make the Hell’s Angels look like babies.”

The accompanying statements went further, claiming thousands of “criminal illegal aliens”—including murderers, rapists, and child predators—were terrorizing Minneapolis, and that ICE was saving the city.
The rhetoric was dramatic.
The numbers were confusing.
The numbers everyone heard—and what they actually mean
Four figures anchor the public claims:
10,000 · 3,000 · 1,360 · 240
They sound precise. They are not equivalent. And only one can be independently verified.
10,000
This is a cumulative DHS claim with no released dataset, no time window, no geographic scope, and no offense breakdown. It cannot be verified and cannot be read as 10,000 violent offenders. The phrase “who were killing Americans” is rhetorical, not statistical.
What it is: an unaudited headline number.
3,000
This refers to total ICE enforcement actions during a short surge period. DHS released no names, no charges, and no breakdown between violent and non-violent cases. Based on the limited subset that was released, most actions were immigration-only, non-violent, or custody transfers.
What it is: a count of mixed enforcement actions, not violent-crime arrests.
1,360
This figure is directly contradicted by Minnesota state data. A point-in-time count found 94 people in county jails and 207 in state prison with ICE detainers—a total of 301, not 1,360. Minnesota officials have publicly stated the federal figure is unsupported by state records.
What it is: a disputed claim contradicted by available evidence.
240
This is the only number released with names, making it the only independently verifiable dataset.
Independent review shows:
- ~21% were immigration cases with no criminality
- ~25% were linked to non-violent cases
- ~33% were already incarcerated or had completed sentences
- ~21% were linked to recent, active violent crimes
What it is: a curated list that does not support the broader claims.
Taken together, these figures show how statistics mislead when stripped of context. Each number can be defended in isolation. Together, they tell a story the data do not support.
The lesson isn’t that numbers are useless.
It’s that numbers without transparency are narrative tools, not evidence.
Violent crime in context
Claims of a Minnesota crime emergency should be evaluated against actual crime data—starting globally.
The United States is a clear violent-crime outlier among wealthy democracies, with homicide rates roughly five times higher than peer nations. This is not a cultural anomaly or a Minnesota problem. It is a national one.
Among countries with similar levels of wealth, democratic stability, and institutional capacity, the U.S. experiences five times higher levels of homicide. This difference is not marginal, episodic, or the result of isolated local conditions. The United States is not in the same class as its commonly cited peer nations when it comes to violent crime.
Violent Crime Among Perceived Peer Nations
- Perceived peer baseline: wealthy developed democracies
- Metric: intentional homicides per 100,000 people
- Peer mean: ~1.2 (baseline for “developed-nation” violence)
Chart: Intentional Homicide Rate (Ordered Low → High)
| Country | Homicide Rate /100,000 | Relative to Peer Mean |
| Japan | ~0.2 | ~1/6 × |
| Germany | ~0.9 | ~3/4 × |
| Australia | ~0.9 | ~3/4 × |
| United Kingdom | ~1.1 | 1 × |
| France | ~1.3 | 1 × |
| Canada | ~2.3 | + 2 × |
—— End of perceived peer group ——
High-Gun / High-Lethality Societies
(U.S. Actual Comparison Class)
Chart: Intentional Homicide Rate (Ordered Low → High)
| Country | Homicide Rate | × Developed-Nation Mean |
|---|---|---|
| Chile | 4.4 | 4× |
| Argentina | 4.5 | 4× |
| United States | 5.8 | 5× |
| Colombia | 6.3 | 5× |
| Mexico | 28 | 23× |
Research is consistent on why: widespread firearm availability and permissive gun policy. Countries with similar social stresses but fewer guns experience far less lethal violence. Americans are not uniquely violent; violence here is simply far more likely to become fatal.
Within that national context, Minnesota sits near the U.S. average and well below high-violence states. It is neither a violent outlier nor experiencing a unique crisis.
Turning the lens inward
This global perspective matters because it reframes how we interpret claims about “violent crime crises” at home.
If violence in the U.S. is structurally elevated compared to peer nations, then:
- Every state exists within that national baseline, and
- Claims that a specific state—like Minnesota—faces a uniquely “massive” violent-crime problem must be judged relative to both national and international norms.
Minnesota, as shown earlier, sits near the U.S. average and far below high-violence states, while the U.S. as a whole already sits well above its peers.
The uncomfortable takeaway
When Americans talk about violent crime, we often externalize the problem—blaming immigrants, cities versus farms and towns – the urban/rural divide, political opponents, or specific states. But the international comparison suggests something more uncomfortable:
The violence problem is not “them.” It’s us.
Until we grapple honestly with the structural drivers that distinguish the U.S. from comparable nations—especially the role of firearms—efforts to redirect fear toward particular communities or states will remain political storytelling, not solutions.
That shift in perspective is essential if we want statistics to illuminate reality rather than obscure it.
Key point: Violent crime exists, but describing current conditions as “massive” or “out of control” nationally is not supported by trend data.
So, which states have the most violent crime?
This depends on whether you measure total volume or per-capita rate—two very different questions.
By total number of violent crimes (volume)
Large states dominate simply because of population size:
| Rank | State | Violent Crimes (≈) | Violent Crime Rate |
| 1 | California | ~176,000 | ~442 |
| 2 | Texas | ~136,000 | ~410 |
| 3 | Florida | ~99,000 | ~384 |
| 4 | New York | ~82,000 | ~426 |
| 5 | Illinois | ~61,000 | ~447 |
These five states account for 46% of all violent crimes nationally, regardless of immigration policy or enforcement posture.
Violent crime rate per capita
Smaller states with concentrated crime problems rank highest:
| Rank | State | Violent Crime Rate (per 100k) | Violent Crimes (≈) |
| 1 | New Mexico | ~1,006 | ~21,400 |
| 2 | Alaska | ~724 | ~5,400 |
| 3 | Tennessee | ~592 | ~42,800 |
| 4 | Arkansas | ~579 | ~17,900 |
| 5 | Louisiana | ~520 | ~23,900 |
These states experience far higher violent-crime intensity than most of the country.
How does Minnesota fit into these statistics?
By volume or per-capita rate intensity,
Minnesota is in neither group.
| Metric | Minnesota / year | United States / year |
|---|---|---|
| Total violent crimes | 15,000 | 1,200,000 |
| Violent crime rate | 359 per 100,000 | 367 per 100,000 |
| National rank (volume) | 23rd | — |
| National rank (rate) | Lower half of states | — |
| Share of national violent crime | 1.6% | 100% |
Minnesota:
- has less than half the violent crime of Michigan,
- about one-eighth that of California,
- and a third of New Mexico’s violent-crime rate.
What would a composite look like?
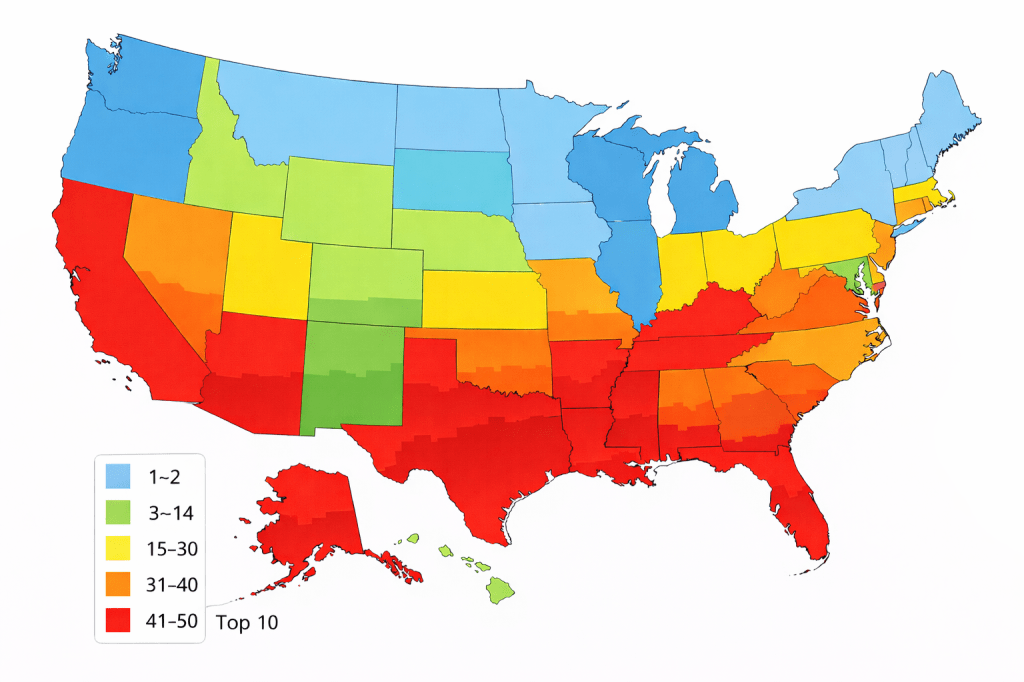
How to Read This Map
- This map shows violent crime across the United States using a composite ranking, not a single statistic. It combines crime rate (per capita) and crime volume (total incidents) into one measure.
- This avoids common distortions: rate-only views overstate small states, while volume-only views overstate large ones. The composite shows where violent crime is both concentrated and consequential.
- States are grouped into five ranked color bands, from lowest to highest combined burden. Lighter colors indicate lower concentration; darker colors indicate higher concentration.
- These are relative rankings, not judgments. Darker does not mean “out of control,” and lighter does not mean “crime-free.”
The map is designed to show where violence is most concentrated when scale and intensity are considered together.
Key point: States most affected by violent crime are not Minnesota and not concentrated in the Upper Midwest.
Immigrants and violent crime
Decades of research show that immigrants—documented and undocumented—commit violent crime at lower rates than native-born citizens. In many cases, higher immigrant populations correlate with lower violence.
Applying national rates to Minnesota predicts hundreds, not thousands, of immigrant violent-crime arrests per year—consistent with the only verifiable ICE data.
There is no evidence immigrants are driving violent crime in Minnesota.
What if Minnesotans were allowed to do the job?
Minnesota has about 600 officers whose primary assignment is pursuing violent criminals, and about 6,000 officers who do so as part of routine policing.
State and local law enforcement make roughly 15,000 violent-crime arrests per year. Based on population shares and crime-rate research, about 630 of those involve immigrants—roughly 52 per month.
ICE reports deploying about 3,000 agents in Minnesota and claims 50 violent immigrant arrests over six weeks.
Over the same period, Minnesota law enforcement would be expected to apprehend about 72 violent immigrant offenders through ordinary policing.
Under these assumptions:
- Minnesota law enforcement apprehends more violent immigrant offenders than ICE.
- On a per-officer basis, Minnesota’s specialized violent-crime units appear roughly seven times more productive than ICE at apprehending violent immigrant offenders.
This raises an obvious question: what is gained by layering a massive federal operation on top of work that is already being done more efficiently?
And, why in Minnesota a lowest tier crime state?
So, back to the question—are these officials lying?
Yes.
They are presenting numbers in ways they know—or should know—are misleading. This is lying by misrepresentation, not error.
Disinformation does not require false numbers. It works by removing context, blurring definitions, and blocking verification – turning statistics into instruments of persuasion. The result is familiar: fear, urgency, and the insistence that
extraordinary threats require extraordinary measures.
What the data show is statistical manipulation.
What the pattern suggests is something more deliberate: the use of inflated or opaque numbers to reframe the problem, justify expanded enforcement, and normalize exceptional power.
If violent crime were truly the issue, Minnesota would not be the focus—and immigrants would not be the target.
So what is this?
A lie?
A damn lie?
Or the strategic use of numbers to manufacture fear, justify power, and secure public consent?
That question—more than any statistic—is the real Rock of the Day.
